IC Markets Home Sign in Web Trader Contact Us
IC Markets Social IC Markets Social

Information Hub for
Serious Traders

  • ABOUT US
  • OPEN LIVE ACCOUNT
  • OPEN DEMO ACCOUNT
  • TRADE NOW
  • VISIT OUR BLOG
IC Markets Social
  • ABOUT US
  • OPEN LIVE ACCOUNT
  • OPEN DEMO ACCOUNT
  • TRADE NOW
  • VISIT OUR BLOG
February 1, 2023European_Indexes_esIC Markets

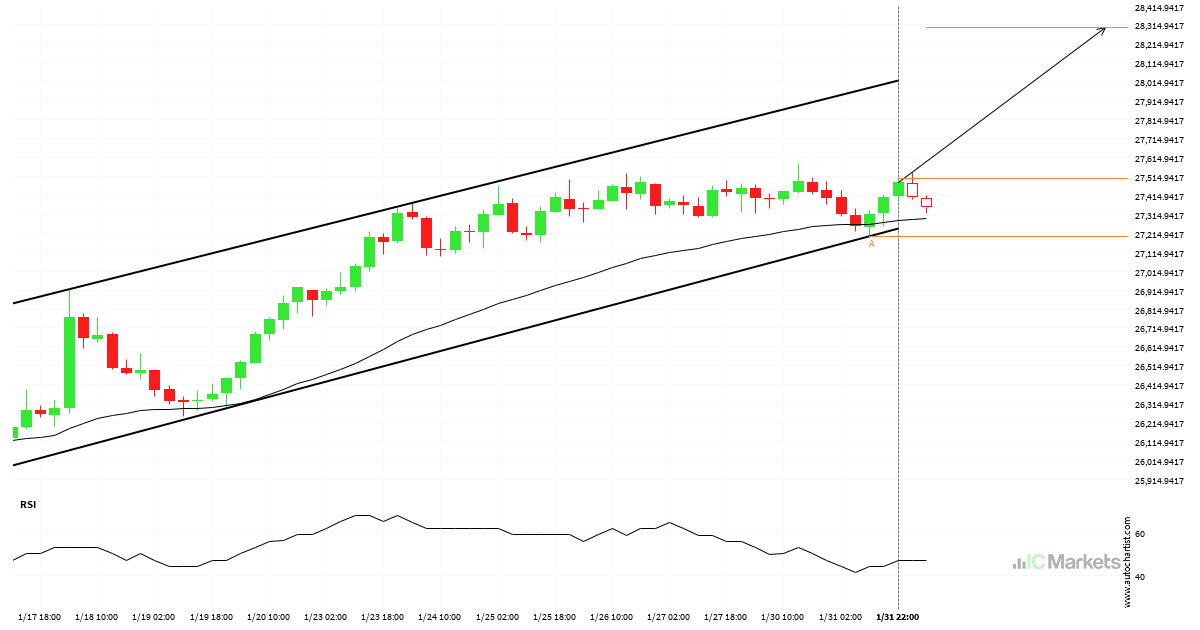
Inminente recuperación o irrupción del Japan 225 Index

El Japan 225 Index se dirige a la línea de resistencia de un Canal alcista. Si este movimiento se mantiene, el precio de Japan 225 Index podría probar el nivel de 28299.5000 en las próximas 3 días. Ya ha probado esta línea en numerosas ocasiones, por lo que este movimiento podría durar poco y terminar […]

Read more
January 31, 2023European_Indexes_esIC Markets

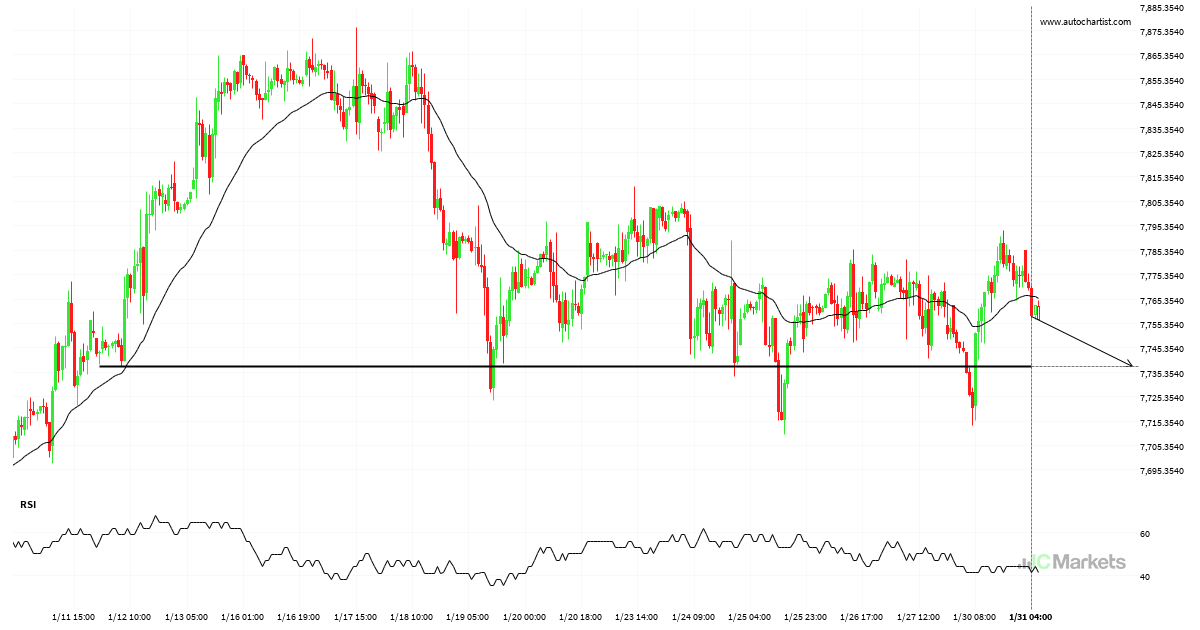
O bien, una inminente recuperación o una ruptura del UK 100 Index

El UK 100 Index avanza hacia la línea de 7737.7998. Si este movimiento se mantiene, el precio del UK 100 Index podría probar el nivel de 7737.7998 en un plazo de 4 días. Pero no se apresure a la hora de operar, porque el par ha probado esta línea en numerosas ocasiones durante el pasado, […]

Read more
January 30, 2023European_Indexes_esIC Markets

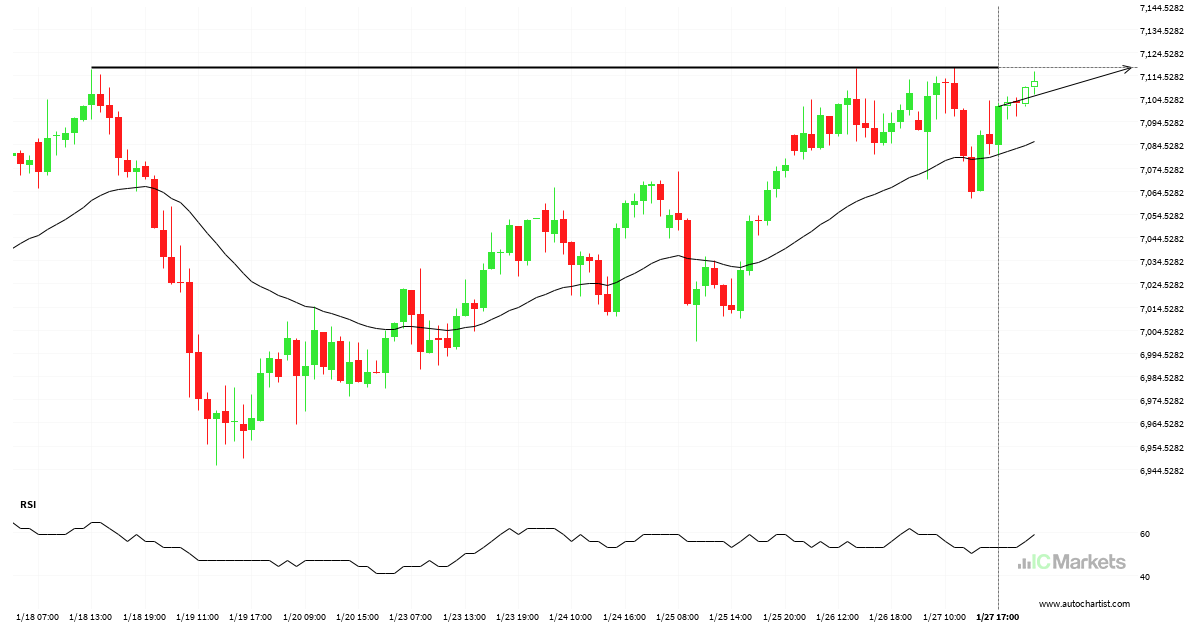
France 40 Index – se acerca a la línea de precio psicológico

El France 40 Index avanza hacia la línea de resistencia de un Resistencia. Como lo hemos observado retrocediendo desde este nivel en el pasado, podríamos observar, o bien una ruptura a través de esta línea o una recuperación de nuevo a los niveles actuales. Ya ha llegado a dicha línea en numerosas ocasiones durante los […]

Read more
January 27, 2023European_Indexes_esIC Markets

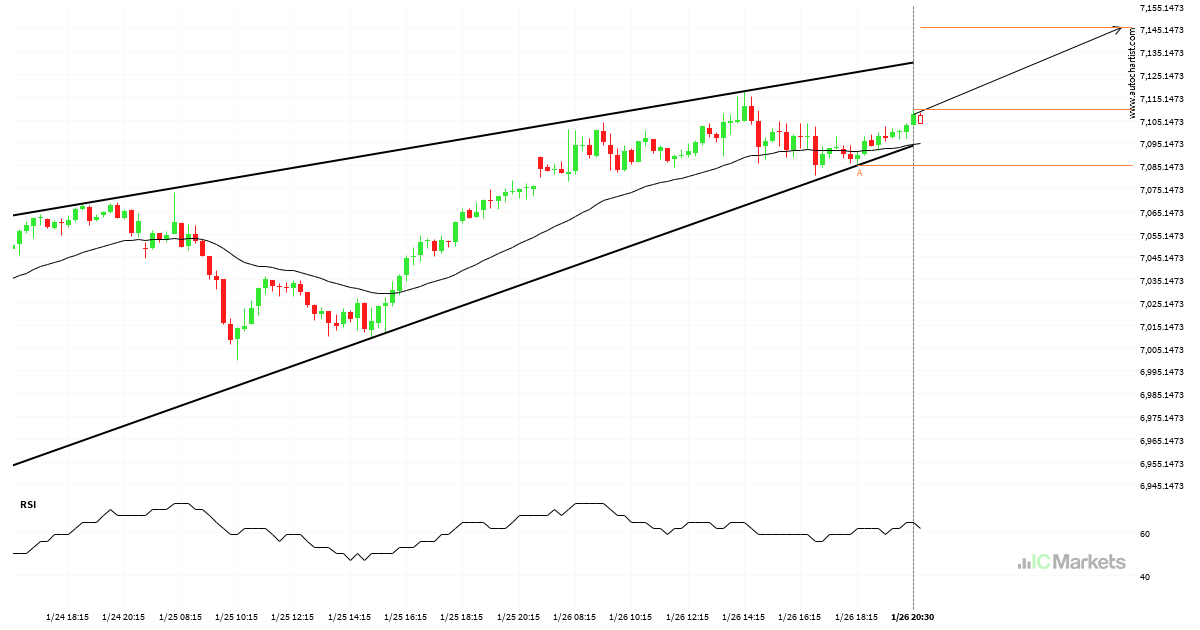
El France 40 Index se aproxima a la resistencia de un Cuña ascendente

El France 40 Index se está acercando a la línea de resistencia de un Cuña ascendente. Ha llegado a esta línea en numerosas ocasiones durante los últimos 3 días. Si vuelve a probarla de nuevo, debería hacerlo en las próximas 9 horas.

Read more
January 26, 2023European_Indexes_esIC Markets

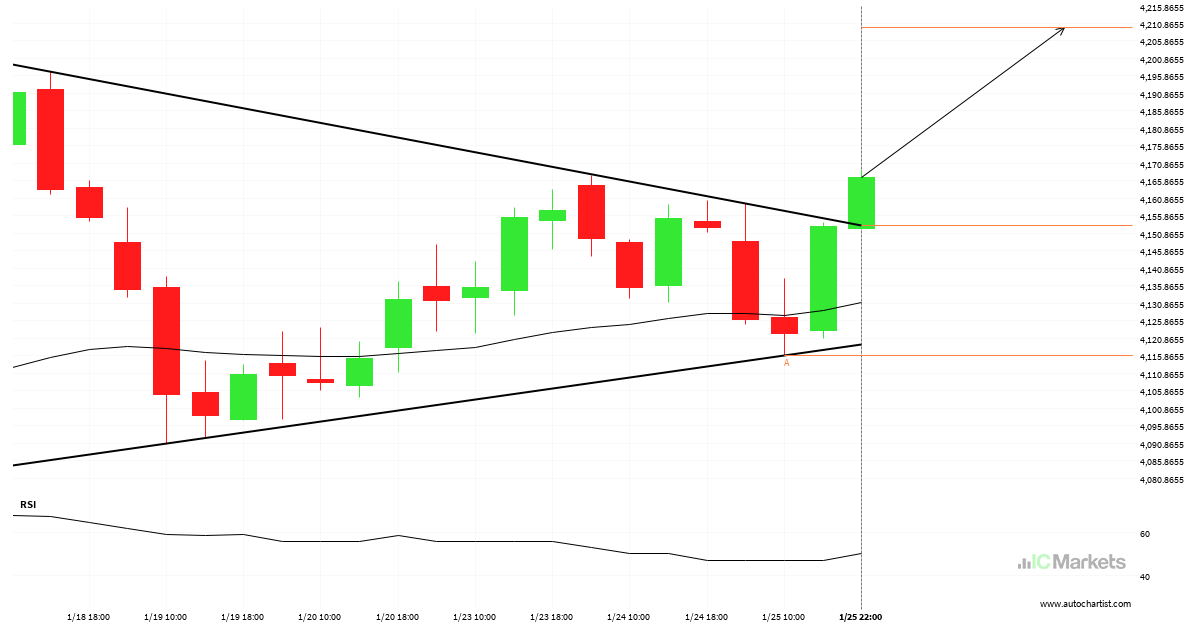
Un posible comienzo de una tendencia alcista en el EU Stocks 50 Index

El EU Stocks 50 Index ha atravesado una línea de resistencia de un patrón de gráfico que corresponde a un Banderín. Si esta irrupción se mantiene, podríamos ver el precio del EU Stocks 50 Index probando el nivel de 4209.6132 dentro de las próximas 2 días. Pero no se apresure si desea operar, porque ya […]

Read more
January 25, 2023European_Indexes_esIC Markets

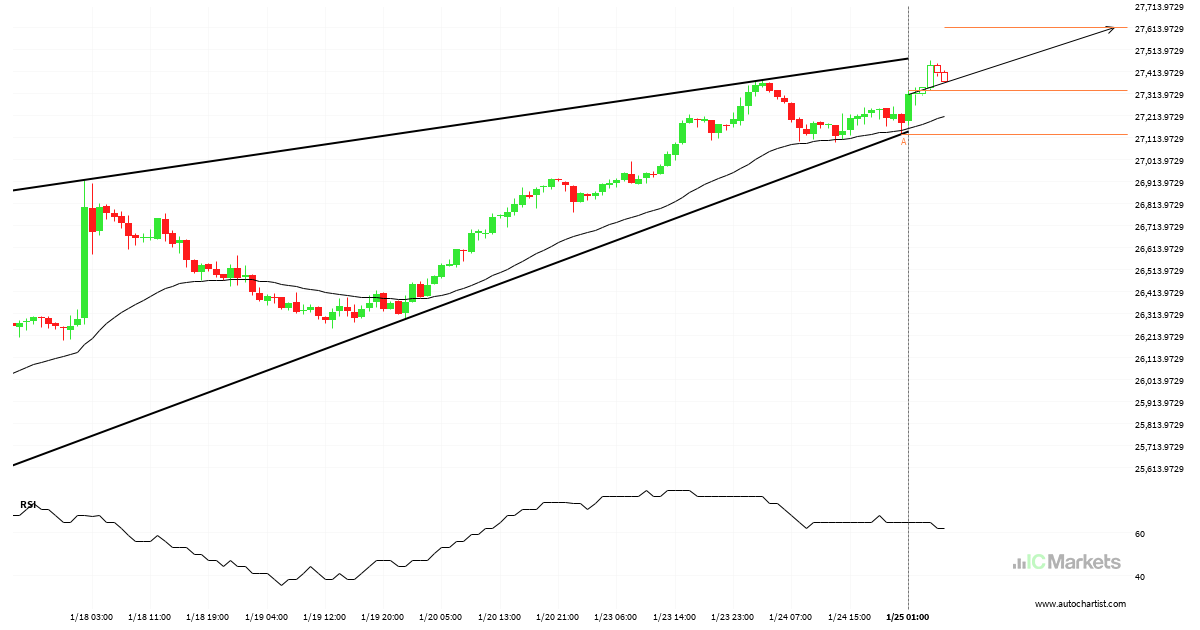
Posible ruptura del nivel de resistencia en el Japan 225 Index

El Japan 225 Index avanza hacia la línea de resistencia de un Cuña ascendente, que ya ha probado varias veces en el pasado. Hemos visto un retroceso antes desde esta línea, así que en esta etapa no está claro si atravesará esta línea o se recuperará como lo ha hecho anteriormente. Si el Japan 225 […]

Read more
January 24, 2023European_Indexes_esIC Markets

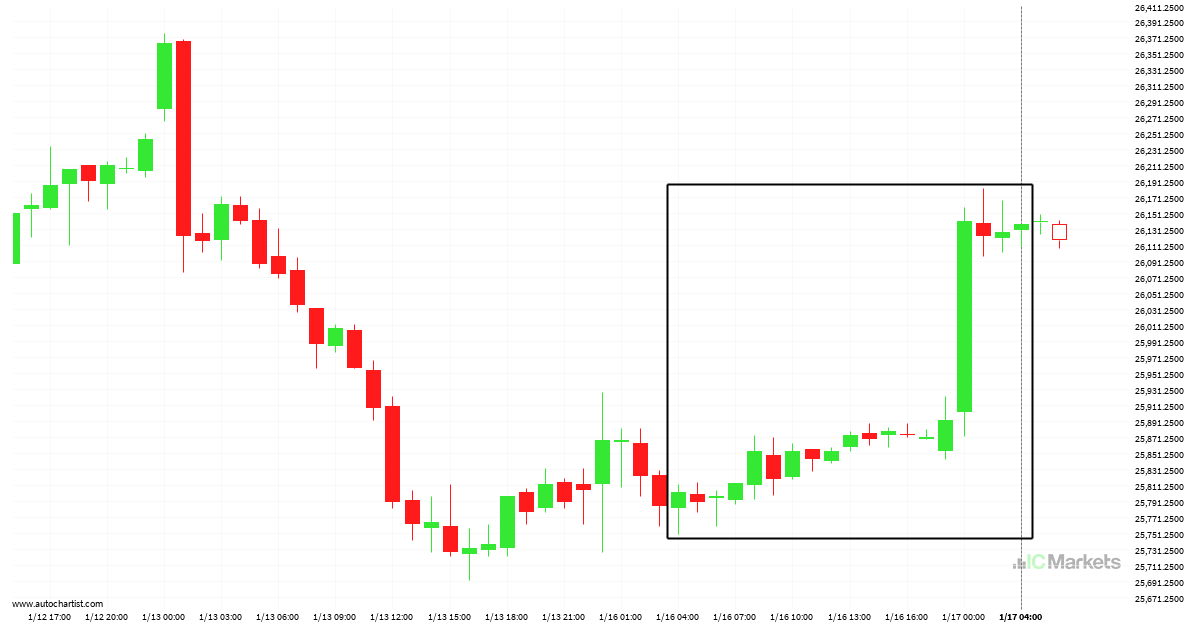
El Japan 225 Index está en dirección up

El Japan 225 Index ha experimentado un excepcional movimiento ascendente de un 2,01% de 26822.0 a 27360.0 en 2 días.

Read more
January 17, 2023European_Indexes_esIC Markets

El Japan 225 Index experimentó un movimiento excepcional

Para aquellos de ustedes que no creen en las tendencias, esta puede ser una oportunidad para aprovechar un excepcional movimiento de un 1,3% en Japan 225 Index. Este movimiento ha ocurrido durante los últimos 2 días. Por otro lado, para aquellos que siguen las tendencias, deben considerar aprovecharse de esta.

Read more
January 16, 2023European_Indexes_esIC Markets

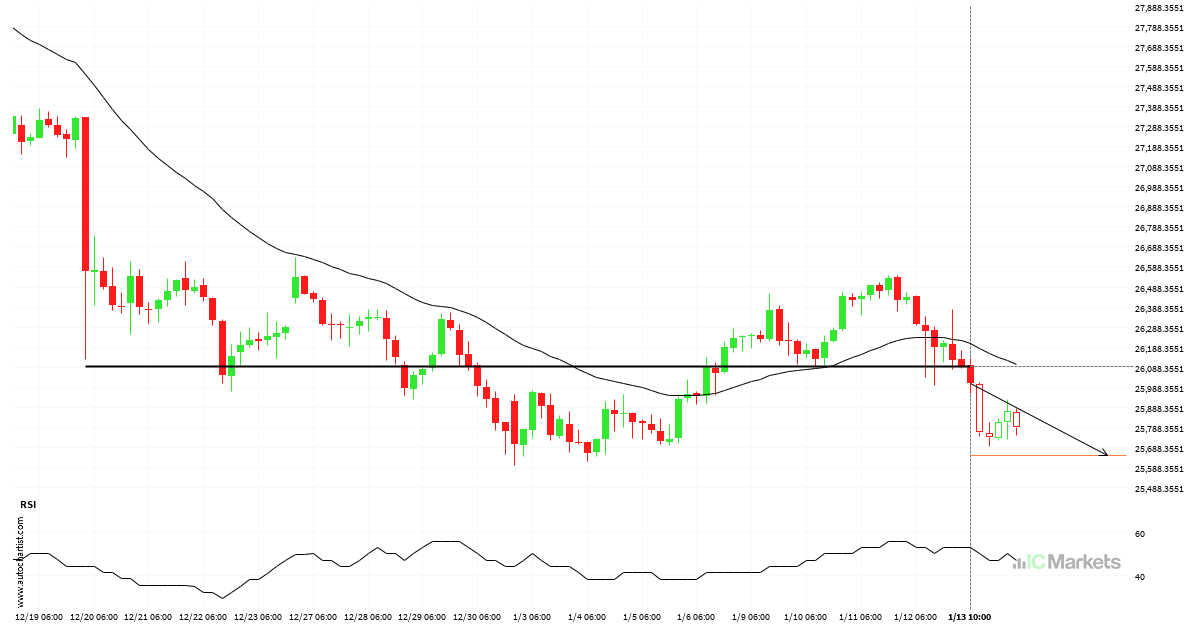
Posible comienzo de una tendencia bajista en el Japan 225 Index

El Japan 225 Index ha atravesado una línea de 26092.0000. Si esta rotura se mantiene, podríamos ver el precio del Japan 225 Index dirigiéndose al nivel de 25648.3008 en las próximas 2 días. Pero no debe apresurarse a la hora de operar, porque ya ha probado esta línea en numerosas ocasiones durante el pasado, por […]

Read more
January 13, 2023European_Indexes_esIC Markets

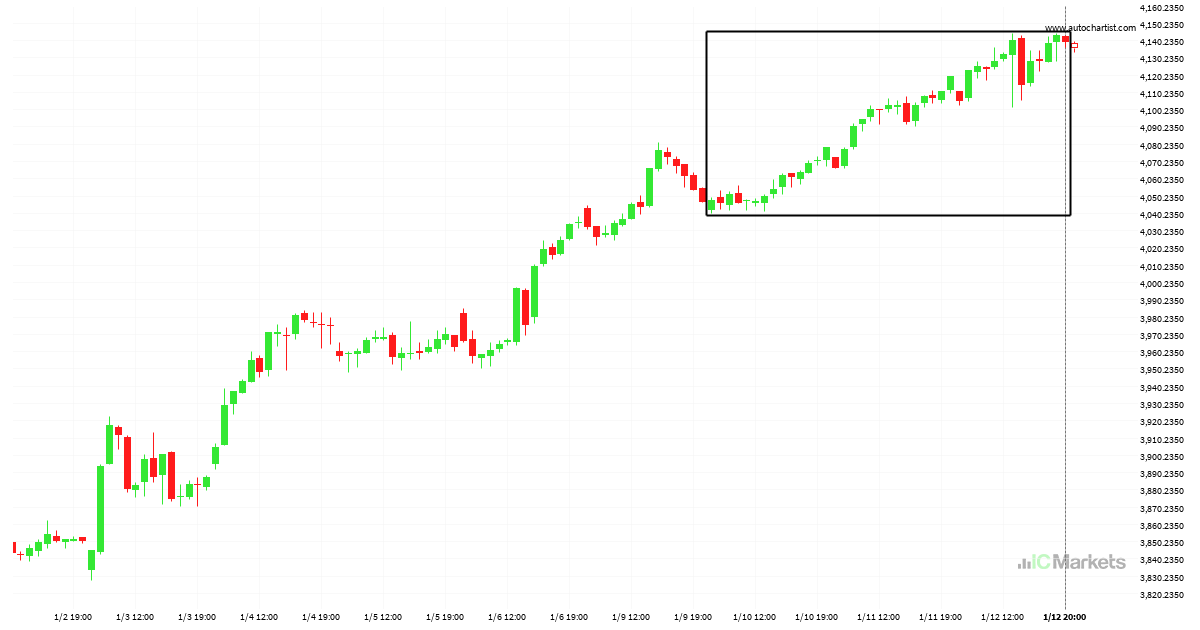
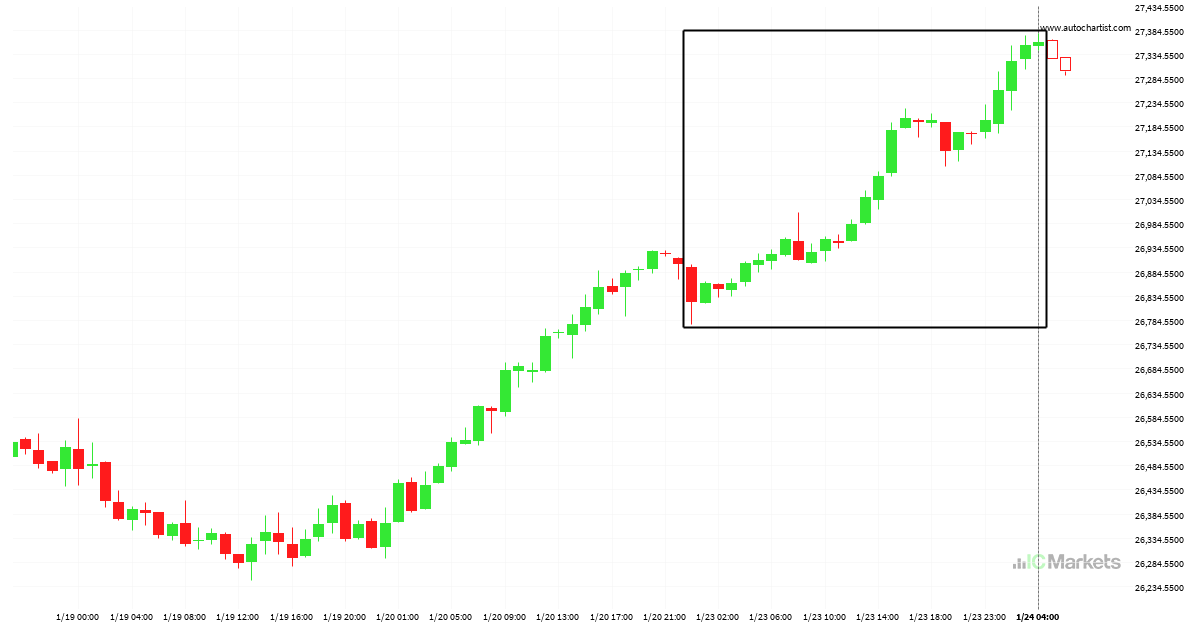
Extraordinario movimiento alcista del EU Stocks 50 Index

El EU Stocks 50 Index ha ascendido un 2,27% de 4047.4 a 4139.4 en 3 días.

Read more
  • 1
  • 2
  • 3
  • …
  • 38
  • 39
  • 40
  • 41
  • 42
  • 43
  • 44
  • …
  • 88
  • 89
  • 90

Recent Posts

  • Either a rebound or a breakout imminent on SILVER
  • GOLD Nível visado: 2976.3601
  • A potential bearish movement on GOLD
  • มีโอกาสเกิดการเคลื่อนตัวแบบ bearish บน GOLD
  • Posible gran movimiento en el AUDJPY

Recent Comments

    Translation


     Edit Translation

    Trade with

    a market leader you can rely on

    Open Trading Account Try a Free Demo

    Forex Trading

    • Accounts Overview
    • Open an Account
    • Launch Web Trader

    Trading Specifications

    • Spreads and Commissions
    • Range of Market
    • Trading Hours
    • Funding
    • Withdrawal

    About IC Markets

    • Help Center
    • Why IC Markets
    • Regulation
    • Legal Documents
    • Contact Us


    Forex Trading

    • Accounts Overview
    • Open an Account
    • Launch Web Trader

    Trading Specifications

    • Spreads and Commissions
    • Range of Market
    • Trading Hours
    • Funding
    • Withdrawal

    About IC Markets

    • Chat with a Specialist 24/7
    • Why IC Markets
    • Regulation
    • Legal Documents
    • Contact Us

    Disclaimer: This material is marketing material where all marketing material is published for informational purposes only. This material does not contain and should not be considered as containing - investment advice and recommendations, or suggestions for performing any actions with financial instruments. The built-in widgets belong to their external independent authors, and IC Markets is not responsible for their content and their impact on trade.

    All content rights reserved. Opinions of the authors may not coincide with the opinion of the blog editors. When copying materials from this site or connecting to an RSS feed to republish our articles, a link to IC Markets or attribution in the format ‘IC Markets Blog’ is required. For general questions, please contact the editorial office via the form on the Contact us page.

    Risk Warning: Trading Derivatives carries a high level of risk to your capital and you should only trade with money you can afford to lose. Trading Derivatives may not be suitable for all investors, so please ensure that you fully understand the risks involved and seek independent advice if necessary. A Product Disclosure Statement (PDS) should be considered before entering into a transaction with us.

    The contents of this page are general information only and does not take into account your personal situation, financial objectives or needs. It is up to you to make sure the products that we offer suit your specific needs. You should not trade with us unless you understand the features and risks of the products that we offer. This means that you might need to seek independent advice before you start trading with us.

    © 2022 Raw Trading Ltd | All rights reserved.
    • Sample Page